Blog
Identifying Subgroup Effects in Regression Discontinuity Designs with Model-Based Recursive Partitioning
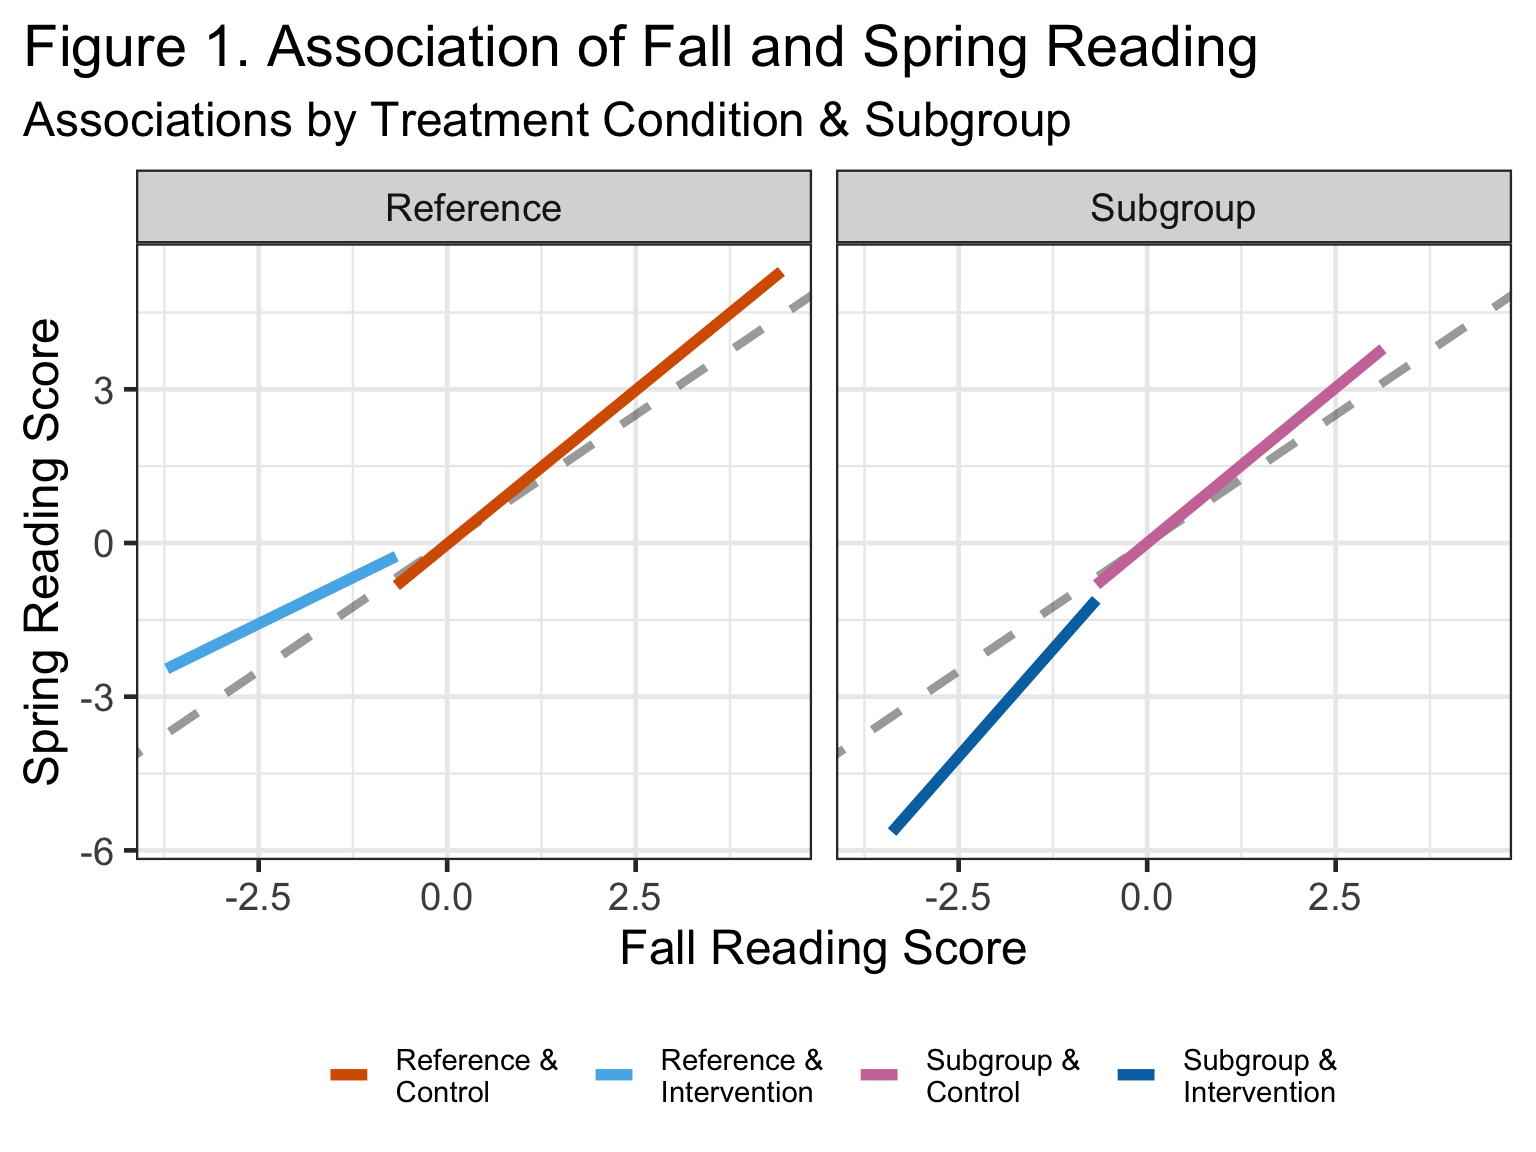
A simulation study to demonstrate the ability of model-based recursive partitioning to identify differential effects in a regression discontinuity design (RDD).
Comparing (Stochastic) Mixed-Effects Tree-Based Models in `{LongituRF}` & `{ranger}`
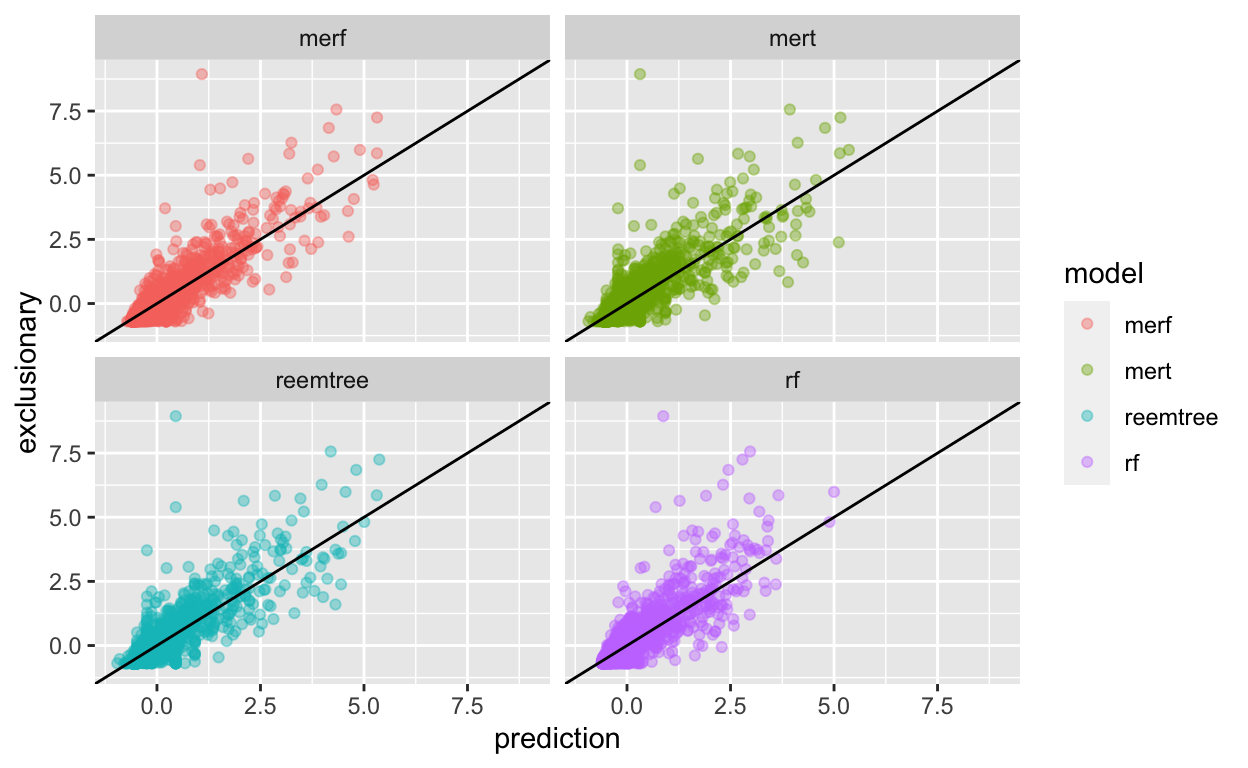
A comparison of (S)MERTs, (S)REEMtrees, (S)MERFs & Traditional Random Forests.
APA 2021 Poster
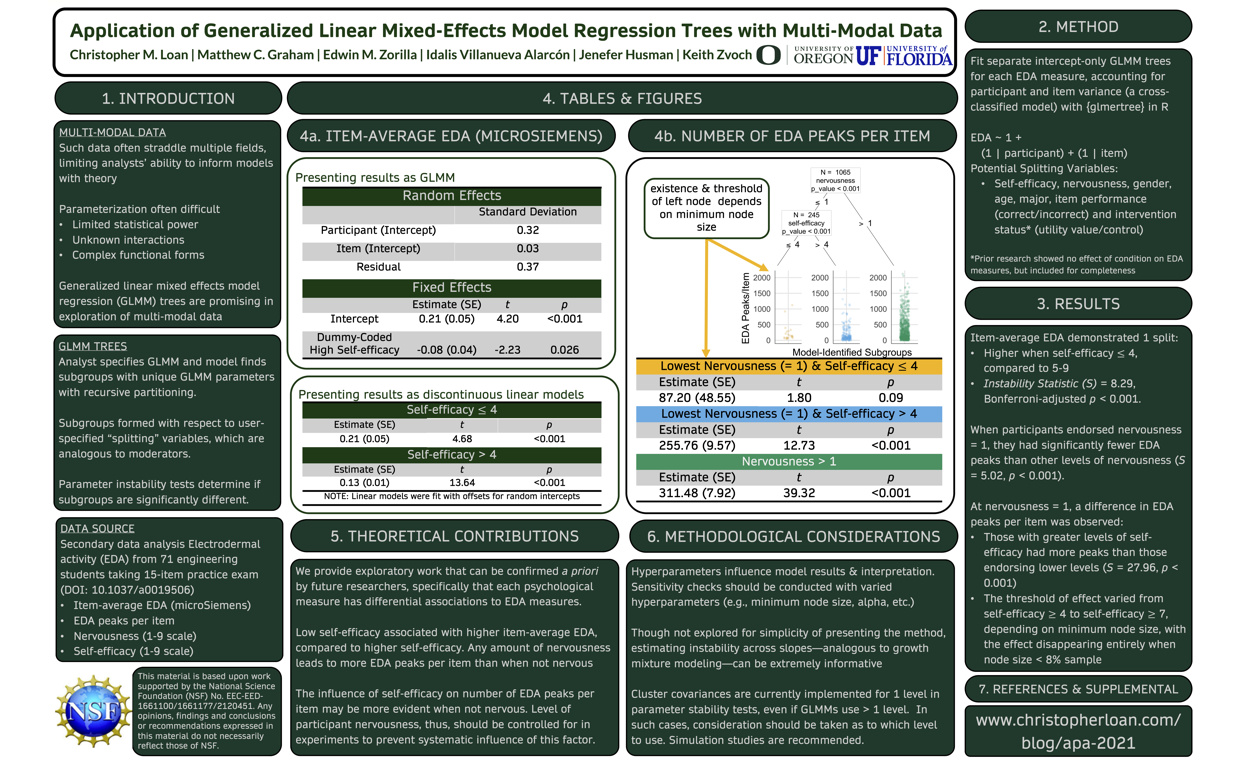
Poster Presented at APA 2021.
APA 2021 Supplemental Material
Supplmental Material for the Application of Generalized Linear Mixed-Effects Model Regression Trees with Multi-Modal Data poster presented at APA 2021, co-authored with Matthew C. Graham, Edwin M. Zorilla, Idalis Villanueva Alarcon, Jenefer Husman, & Keith Zvoch
Simulating Non-Linear Interactions
Simulating 2-level data for APA 2021 Supplemental, so others can follow along.
Simulating Multilevel Linear Data with Interaction
function to simulate multilevel data with interaction.

Quantifying Pandemic-Era Growth in Disc Golf by Webtraffic
Trying to figure out why the disc golf course is so crowded these days, with code.

Impact of GKPro Sponsorship on OTB & GKPro Webtraffic
An example of leveraging free data to benefit a company, with code.

Introduction to Growth & Parallel Process Models in `{lavaan}`
A tutorial to parameterize and plot results of a parallel process model (PPM) in `{lavaan}`.

An introduction to `{Tidymodels}`: Decision Tree Learning in R
Exploring Decision Tree Variants in `{tidymodels}`.